Stockchase Panic-Proof Portfolio – May 2023 Update

A year to forget?
2022 was a year most equity investors will likely want to forget as markets saw some of the largest bear retracements since the financial crisis of 2008.
The outlook for corporate earnings grew uncertain with ongoing pandemic-related supply chain issues, the Russian invasion of Ukraine, recessionary fears, and many other fundamental factors. These combined to accelerate global inflation rates to multi-decade highs – historically a harbinger for market declines.
Panic-Proof Portfolio proves it’s no-panic grounds
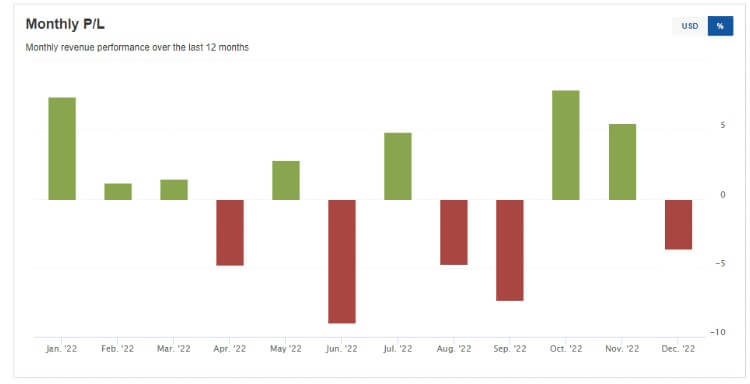
One of the bright spots, however, was the performance of the Stockchase Panic-Proof Portfolio. Although it did not show a gain in 2022, its decline was less than 1%.

In 2022 the Panic-Proof Portfolio saw two months with gains in excess of 7%, two months with losses over 7%, and 7 months registered gains overall.

Stop-loss Strategy
Stockchase Research Editor, Michael O’Reilly, attributes the success of the model portfolio to a unique strategy that includes setting a “stop-loss” on every position along with a profit objective. This is in addition to a selection process that focuses on solid fundamentals of cash flow, return on equity, and relative valuation.
The profit objective is a stock price level analysts have collectively suggested for a 12 month target and generally targets 18% return or higher. When the stock achieves this objective, O’Reilly recommends taking profit on half of the position. The balance of the position is then allowed to trade higher with no further upside profit trigger to cover the position – “thus allowing the winners to run”, he says.
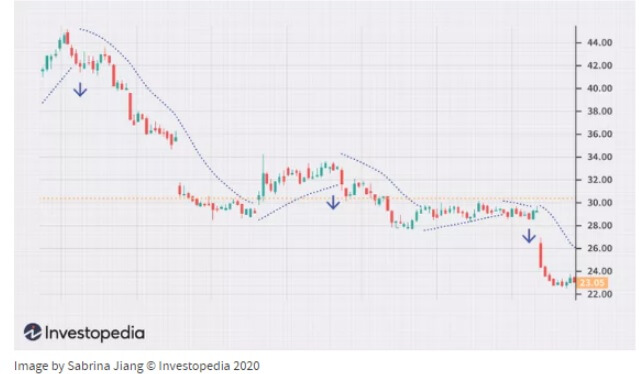
The stop-loss is a price point at which the position should be exited if the stock prices falls below that trigger point. It is set using a method that takes into account the underlying trend of the stock price and the volatility that stock typically trades within. The stop is reviewed regularly and often increased (or trailed higher) over time – it is never lowered from its original entry.
Capital Preservation
“This ensures capital is preserved in the event of an unforeseen negative change in the overall market direction or within the fundamentals of the company”, says O’Reilly. “By regularly reviewing the stop level and trailing it higher over time, it also protects capital from being trapped in a stock that is not continuing to advance”, he adds.
The Panic-Proof Portfolio uses a Parabolic SAR (Stop-And-Reverse) indicator to establish the stop level to exit a position. The indicator was developed by J. Welles Wilder Jr. – the creator of the Relative Strength Index (RSI) indicator. O’Reilly applies the calculated stop level of the indicator using a weekly candlestick technical chart. When applied on a technical chart it provides a series of estimates of an appropriate stop over time.

“I’ve relied on the Parabolic SAR in my 35 years of personal investing and as a professional commodity analyst and trader during my career. It is also very useful to help understand major market trends when combined with Elliot Wave theory.”
Where will the market go in 2023?
“So far our Panic-Proof Portfolio is rallying along with the likes of the TSX through end-March (up about 3%), but lagging behind the bounce of the NASDAQ and S&P 500. I’m encouraged by the rally of the markets overall from the lows last October. However, there are many fundamental headwinds still to be dealt with – inflation and recessionary fears continuing to be front and centre. I think we will be grateful again to follow a strategy that recommends a cautious approach.”
How to get access to the Panic-Proof Portfolio?
You’re missing Mike’s recommendations if you’re not a Premium member. Get access to Mike’s Panic-Proof Portfolio every Monday and Wednesday, plus more features on Stockchase by subscribing today!
Become a Premium member today!


